International coffee prices have been experiencing a downward trend in the last two years, averaging 102.41 US cents/lb in August 2018, a 20.1% drop compared to August 2017, says ICO’ monthly report for August 2018.
The last time the monthly composite indicator price was lower than 102.41 US cents/lb was in November 2013, when it recorded 100.99 US cents/lb.
This decline is linked primarily to market fundamentals, though other factors, such as exchange rate movements and futures markets, are also playing a role.
Total exports in July 2018 amounted to 10.11 million bags in July 2018, compared with 9.66 million in July 2017.
Exports in the first 10 months of coffee year 2017/18 (Oct/17 to Jul/18) have increased by 0.9% to 101.2 million bags, compared to 100.34 million bags in the same period in the last coffee year.
Coffee prices continued their downward trend as the monthly average of the ICO composite indicator fell to 102.41 US cents/lb in August 2018, 4.5% lower than in July 2018 and 20.1% lower than in August 2017.
This represents the lowest monthly average composite indicator since November 2013, when it reached 100.99 US cents/lb and the lowest monthly average for August since 2006, when the monthly indicator price was 95.78 US cents/lb.
In August 2018 the daily composite indicator moved within a range of 98.63 US cents/lb and 106.65 US cents/lb. The fall to 98.63 US cents/lb on 31 August was the lowest daily price since 14 November 2013 when it was 98.11 US cents/lb.
Prices for all group indicators fell for the third consecutive month in August 2018. The largest decrease occurred in the average price for Brazilian Naturals, which fell by 5.5% to 104.46 US cents/lb, followed by a decline of 4.4% to 80.74 US cents/lb for Robusta. Other Milds decreased by 4.1% to 125.21 US cents/lb, while Colombian Milds fell by 2.9% to 129.99 US cents/lb.
This increased the differential between Colombian Milds and Other Milds by 44% to 4.78 US cents/lb due to the less marked decrease for Colombian Milds.
The average arbitrage in August, as measured on the New York and London futures markets, fell by 6% to 36.18 US cents/lb, which is the second consecutive month of decrease. However, intra-day volatility of the ICO composite indicator price increased by 0.4 percentage points to 5.2% as intra-day volatility for all indicators increased.
After rising near the end of 2016, reaching 145.82 US cents/lb in November 2016, coffee prices have trended downward, with increases in only five of the last twenty months.
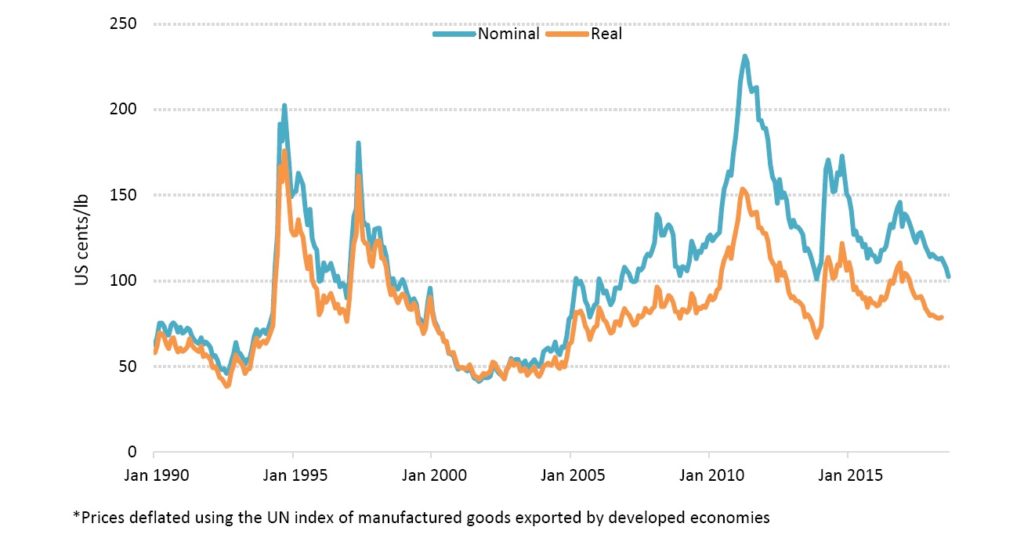
It is useful to compare the development of coffee prices in both real and nominal terms to understand better the current situation compared to previous cycles of low coffee prices.
The figure below compares the ICO composite indicator price in nominal and real terms since 1990, i.e. the period in which coffee has been traded on the free market, after the end of ICO economic clauses.
The longest period of low prices in both real and nominal terms was between 1999 and 2004.
This figure shows that the current price in real terms is still around 7 US cents/lb above the most recent drop in the international coffee price in November 2013 and 32 US cents/lb above the lowest price of September 2001.
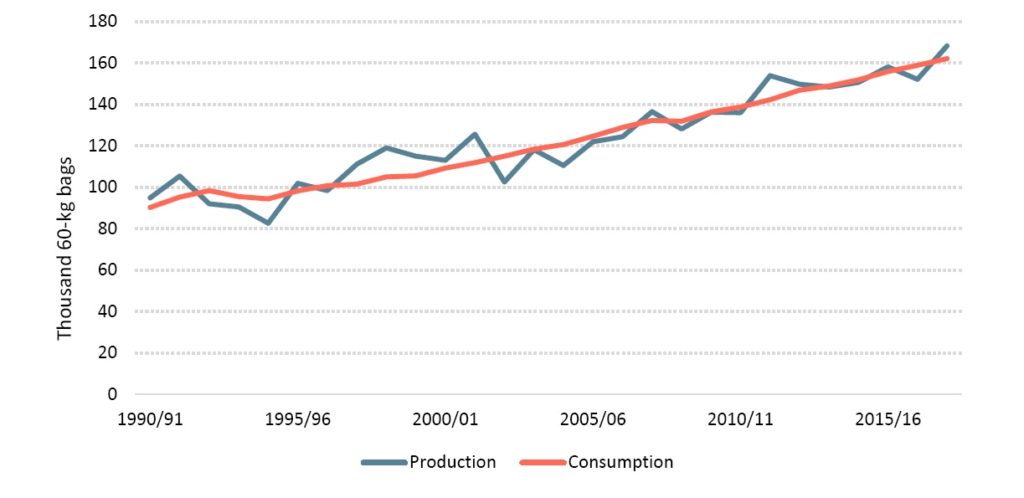
 Market fundamentals are one of the drivers of the current low prices with a number of producing countries expected to harvest bumper crops. Total world production for crop year 2017/18 is estimated at 158.6 million bags in 2017/18.
Nonetheless, production is expected to increase by 14.2%, to 78.4 million bags in 2018/19 for countries with an April-March crop year. The 2018/19 production for this group of countries started in April 2018, and is currently being sold on the world market.
Production in the remaining countries has steadily increased since 2012/13, with production in 2017/18 estimated 7.6% higher at 89.96 million bags following a 1.1% increase to 83.59 million bags in 2016/17.
In contrast to production, which significantly fluctuates from season to season while following an overall upward trend, world coffee consumption has steadily grown at an average annual rate of 2%, increasing from 90.28 million bags in 1990/91 to an estimated 162.12 million bags in 2017/18.
The largest gains are expected to occur in South America, where consumption is estimated at 26.97 million bags, 3.3% higher than in 2016/17 with much of the growth attributed to Brazil.
Consumption in Asia & Oceania is estimated 3% higher, at 35.8 million bags, while consumption in North America is estimated 2.6% higher, at 30.34 million bags.
 Total exports in July 2018 increased by 4.6% to 10.11 million bags, compared to July 2017. Exports of Colombian Milds grew by 8%, to 1.18 million bags, and Brazilian Naturals grew by 11.5%, to 2.38 million bags, while Other Milds fell by 2.4%, to 2.57 million bags. Shipments of Robusta increased 4.7%, to 3.99 million bags.
Total coffee exports for October 2017 through July 2018 were 0.9% higher than those in the same period one year ago.
This growth was led by increased shipments of Robusta, which reached 37.81 million bags, 3.6% higher than one year ago, and of Other Milds, which grew by 3.5% to 23.69 million bags.
In the first 10 months of coffee year 2017/18, exports of Colombian Milds and Brazilian Naturals decreased by 4.8% to 11.66 million bags and 2.3% to 28.04 million bags, respectively.
Brazil’s exports grew 24.2% to 2.33 million bags in July 2018, which greatly contributed to the increased shipments of Robusta and Brazilian Naturals. In the first 10 months of 2017/18, its exports were 4% lower than in October 2016 to July 2017.
While total exports in May 2018 were much lower than in previous years due to a nationwide trucking strike, shipments of all forms of coffee recovered in the following two months reaching 4.9 million bags, which is 19.9% higher than in 2017 and 10.3% higher than in 2016, encouraged by a sharp depreciation in the Real since the start of the year.
In July 2018, green Arabica shipments increased 5.8%, to 1.67 million bags, compared to July 2017, while green Robusta exports reached 366,663 bags in July 2018, compared with 19,825 bags in July 2017 and 38,238 bags in July 2016.
Brazil’s current shipments are coming primarily from its new crop, which began to be harvested in April 2018 and is expected to be larger than in 2017/18, as Arabica production is in an on-year of its biennial cycle and Robusta production has recovered from the drought in previous years.
In July 2018, Vietnam’s exports reached an estimated 2.22 million bags, 20.7% higher than in July 2017, and is the second largest volume on record for July following July 2014 when shipments reached 2.24 million bags.
Further, shipments in the first ten months of coffee year 2017/18 are estimated to have increased by 19.5% to 24.2 million bags. The growth in exports comes from the estimated 15.5% increase in production to 29.5 million bags for crop year 2017/18.
Colombia’s exports rose by 7.5% to 1.08 million bags in July 2018. However, its total shipments for October 2017 to July 2018 are 5.4% lower at 10.57 million bags. Total shipments for crop year 2017/18 represent 75.5% of production, which is estimated at 14 million bags.
This is behind the pace of last year’s sales when 76.3% of its 2016/17 crop was exported by July, but slightly ahead of the five-year average of 74.4%.
Colombia’s output for October 2017 to August 2018 reached 12.77 million bags, which is 4.7% lower than the same period one year ago, according to the National Federation of Coffee Growers of Colombia.
In July 2018, Honduras shipped 0.69 million bags, 10.8% lower than in July 2017, and total exports in the first ten months of crop year 2017/18 are 2.8% lower at 6.44 million bags.
Poor weather and labour shortages have greatly contributed to the reduced volume of exports despite a larger crop in 2017/18, which is estimated 12% higher at 8.35 million bags compared to crop year 2016/17.
Honduras’s output has recovered greatly from an outbreak of coffee leaf rust, averaging a growth of 16.4% a year since crop year 2013/14, and surpassing Ethiopia as the third largest Arabica producer in crop year 2016/17.
Indonesia’s exports are estimated 33.6% lower, at 4.69 million bags for October 2017 through to July 2018. Indonesia currently has limited availability of coffee for export, as its production is estimated to decrease for the second consecutive season, reaching 10.9 million bags in 2017/18, 5.1% lower than last season.
A prolonged rainy season at the start of coffee year 2017/18 impacted yield and hampered dry processing of coffee cherries. This has contributed to the decline in output and exports of coffee.
Ethiopia was the sixth largest exporter in July 2018 with shipments of 0.42 million bags, 15.6% higher than in July 2017. Further, its exports for October 2017 through to July 2018 grew 8.5% to 3.08 million bags.
Ethiopia’s production is estimated 4.8% higher at a record output of 7.65 million bags in crop year 2017/18.


