BEIJING, China – Luckin Coffee Inc. today announced its unaudited financial results for the three months ended March 31, 2023. Total net revenues were RMB4,436.7 million (US$646.0 million) in the first quarter of 2023, representing an increase of 84.5% from RMB2,404.6 million in the same quarter of 2022. Net revenues growth was primarily driven by the increase in the number of products sold, the increase in stores in operation and the increase in the number of monthly transacting customers.
- Revenues from product sales were RMB3,301.3 million (US$480.7 million) in the first quarter of 2023, representing an increase of 77.9% from RMB1,855.3 million in the same quarter of 2022.
- Net revenues from freshly brewed drinks were RMB2,934.3 million (US$427.3 million), representing 66.1% of total net revenues in the first quarter of 2023, compared to RMB1,652.6 million, or 68.8% of total net revenues, in the same quarter of 2022.
- Net revenues from other products were RMB244.6 million (US$35.6 million), representing 5.5% of total net revenues in the first quarter of 2023, compared to RMB109.1 million, or 4.5% of total net revenues, in the same quarter of 2022.
- Net revenues from others were RMB122.4 million (US$17.8 million), representing 2.8% of total net revenues in the first quarter of 2023, compared to RMB93.6 million, or 3.9% of total net revenues, in the same quarter of 2022.
- Revenues from partnership stores were RMB1,135.4 million (US$165.3 million) in the first quarter of 2023, representing 25.6% of total net revenues, which is an increase of 106.7% compared to RMB549.3 million, or 22.8% of total net revenues, in the same quarter of 2022. For the first quarter of 2023, revenues from partnership stores included sales of materials of RMB743.2 million (US$108.2 million), profit sharing of RMB160.0 million (US$23.3 million), sales of equipment of RMB123.3 million (US$18.0 million), delivery service of RMB100.6 million (US$14.6 million) and other services of RMB8.4 million (US$1.2 million).
Total operating expenses were RMB3,758.4 million (US$547.3 million) in the first quarter of 2023, representing an increase of 57.4% from RMB2,388.5 million in the same quarter of 2022. The increase in total operating expenses was predominantly the result of the Company’s business expansion. Meanwhile, operating expenses as a percentage of net revenues decreased to 84.7% in the first quarter of 2023 from 99.3% in the same quarter of 2022, due to increased economies of scale and the Company’s technology-driven operations.
- Cost of materials were RMB1,754.7 million (US$255.5 million) in the first quarter of 2023, representing an increase of 78.5% from RMB983.2 million in the same quarter of 2022, which was generally in line with the increase in the number of products sold and the increase in sales of materials to partnership stores.
- Store rental and other operating costs were RMB891.7 million (US$129.8 million) in the first quarter of 2023, representing an increase of 52.2% from RMB586.0 million in the same quarter of 2022, mainly due to the increase in labor costs, store rental as well as utilities and other store operating costs as a result of the increased number of stores and items sold in the first quarter of 2023 compared to the same period last year.
- Depreciation and amortization expenses were RMB108.5 million (US$15.8 million) in the first quarter of 2023, representing an increase of 13.3% from RMB95.7 million in the same quarter of 2022, mainly due to the increase in amortization of leasehold improvements for the stores and the increase in depreciation expenses of additional equipment put into use in new stores in the first quarter of 2023.
- Delivery expenses were RMB421.7 million (US$61.4 million) in the first quarter of 2023, representing an increase of 70.9% from RMB246.7 million in the same quarter of 2022, mainly due to the increase in the number of delivery orders.
- Sales and marketing expenses were RMB199.4 million (US$29.0 million) in the first quarter of 2023, representing an increase of 84.0% from RMB108.4 million in the same quarter of 2022, mainly driven by the increase in (i) advertising expenses as the Company continued to make strategic investments in its branding through various channels, (ii) commissions to third-party delivery platforms which is in line with the increase in the number of delivery orders and (iii) subcontract service fees to support the Company’s e-commerce business. Sales and marketing expenses amounted to 4.5% of total net revenues in the first quarter of 2023, which was generally stable when compared to 4.5% of total net revenues in the same quarter of 2022.
- General and administrative expenses were RMB360.8 million (US$52.5 million) in the first quarter of 2023, representing an increase of 11.7% from RMB323.0 million in the same quarter of 2022. The increase in general and administrative expenses was mainly driven by the increase in (i) payroll costs for headquarter staff, (ii) tax surcharges, (iii) research and development expenses and (iv) expenditures for office supplies, offset by the decrease of share-based compensation for restricted share units and options issued to management and employees. General and administrative expenses amounted to 8.1% of total net revenues in the first quarter of 2023, compared to 13.3% of total net revenues in the same quarter of 2022.
- Store preopening and other expenses were RMB15.7 million (US$2.3 million) in the first quarter of 2023, representing an increase of 90.0% from RMB8.3 million in the same quarter of 2022, mainly due to more stores being opened in the first quarter of 2023 compared to the same quarter of 2022. Store preopening and other expenses amounted to 0.4% of total net revenues in the first quarter of 2023, compared to 0.3% of total net revenues in the same quarter of 2022.
- Losses and expenses related to Fabricated Transactions and Restructuring were RMB5.9 million (US$0.9 million) in the first quarter of 2023, representing a decrease of 84.1% from RMB37.3 million in the same quarter of 2022, as the Company had successfully completed its provisional liquidation in March 2022 and substantially resolved all outstanding litigations. The losses and expenses related to Fabricated Transactions and Restructuring consisted primarily of professional and legal fees for U.S. securities litigations and other advisory service fees. Losses and expenses related to Fabricated Transactions and Restructuring amounted to 0.1% of total net revenues in the first quarter of 2023, compared to 1.6% of total net revenues in the same quarter of 2022.
- Store level operating profit margin – self-operated stores was 25.2% in the first quarter of 2023, compared to 18.5% in the same quarter of 2022, primarily due to the benefits of economies of scale from the increased number of products sold.
GAAP operating income was RMB678.4 million (US$98.8 million) in the first quarter of 2023, representing a GAAP operating income margin of 15.3%, compared to RMB16.1 million, or a GAAP operating income margin of 0.7%, in the same quarter of 2022. Non-GAAP operating income was RMB730.5 million (US$106.4 million) in the first quarter of 2023, representing a non-GAAP operating income margin of 16.5%, compared to RMB92.1 million, or a non-GAAP operating income margin of 3.8%, in the same quarter of 2022. For more information on the Company’s non-GAAP financial measures, please see the section “Use of Non-GAAP Financial Measures” and the table captioned “Reconciliation of Non-GAAP Measures to the Most Directly Comparable GAAP Measures” set forth at the end of this press release.
Net income was RMB564.8 million (US$82.2 million) in the first quarter of 2023, compared to RMB19.8 million in the same quarter of 2022. Non-GAAP net income was RMB616.9 million (US$89.8 million) in the first quarter of 2023, representing a non-GAAP net income margin of 13.9%, compared to RMB99.1 million, or a non-GAAP net income margin of 4.1%, in the same quarter of 2022.
Basic and diluted net income per ADS was RMB1.76 (US$0.24) and RMB1.76 (US$0.24) in the first quarter of 2023, respectively, compared to basic and diluted net income per ADS was RMB0.08 and RMB0.08 in the same quarter of 2022, respectively.
Non-GAAP basic and diluted net income per ADS was RMB1.92 (US$0.24) and RMB1.92 (US$0.24) in the first quarter of 2023, respectively, compared to basic and diluted net income of RMB0.32 and RMB0.32 in the same quarter of 2022, respectively.
Net cash provided by operating activities was RMB1,072.6 million (US$156.2 million) in the first quarter of 2023, compared to RMB107.7 million in net cash provided by the same quarter of 2022.
Cash and cash equivalents, restricted cash and short-term investments were RMB4,386.0 million (US$638.7 million) as of March 31, 2023, compared to RMB3,577.9 million as of December 31, 2022. The increase was primarily attributable to operational cash generation.
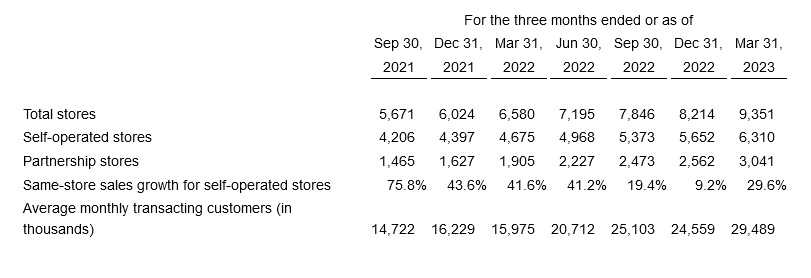
Luckin Coffee: Key Operating Data
 Total net revenues include revenues from product sales and revenues from partnership stores.
- Revenues from product sales include net revenue from the sales of freshly brewed and non-freshly brewed items through self-operating stores, unmanned machines, e-commerce and revenue from delivery for self-operated stores.
- Revenues from self-operated stores include net revenue from the sales of freshly brewed and non-freshly brewed items through self-operating stores, and delivery fees derived from self-operated stores paid by the Company’s customers. Before the first quarter of 2023, the definition of revenues from self-operated stores did not include delivery fees derived from self-operated stores paid by the Company’s customers. Comparative figures from previous periods presented were also adjusted to be consistent.
- Revenues from partnership stores include net revenue from the sales of materials, equipment, and other services including delivery and pre-opening services provided to partnership stores and profit sharing from partnership stores.
- Same-store sales growth for self-operated stores. Defined as the growth rate of total revenue from self-operated stores that has been in operation as at the beginning of the comparable period and was not closed before the current period ending with the number of average operating days over 15 per month over both the current period and last year’s comparable period.
- Store level operating profit – self-operated stores. Calculated by deducting cost for self-operated stores including cost of direct materials (including wastage in stores), cost of delivery packaging materials, storage and logistics expenses, commissions to third-party delivery platforms related to revenues from self-operated stores, store depreciation expense (including decoration loss for store closure), store rental and other operating costs, delivery expense, transaction fees, store preopening and other expenses from the Company’s self-operated store revenues. Before the first quarter of 2023, commissions to third-party delivery platforms related to revenues from self-operated stores were not deducted when calculating this term. Comparative figures from previous periods presented were also adjusted to be consistent.
- Store level operating profit margin – self-operated stores. Calculated by dividing store level operating profit by total revenues from self-operated stores.
- Total number of stores. The number of stores open at the end of the period, excluding unmanned machines.
- Net new store openings. The number of gross new stores opened during the period minus the number of stores closed during the period.
- Average monthly transacting customers. The total of each month’s number of transacting customers divided by the number of months during the period (includes those of partnership stores and those only paid with free-coupons).
- Non-GAAP operating income. Calculated by operating income excluding share-based compensation expenses.
- Non-GAAP net income. Calculated by net income excluding recurring item of share-based compensation expenses and non-recurring item of provision for equity litigants.
- Non-GAAP net income attributable to the Company’s ordinary shareholders. Calculated by adjusting net income attributable to the Company’s ordinary shareholders excluding recurring item of share-based compensation expenses and non-recurring item of provision for equity litigants.
- Non-GAAP basic and diluted net income per shares. Calculated as non-GAAP net income attributable to the Company’s ordinary shareholders divided by weighted average number of basic and diluted share.
- Non-GAAP basic and diluted net income per ADSs. Calculated as non-GAAP net income attributable to the Company’s ordinary shareholders divided by weighted average number of basic and diluted ADS.


