


BEIJING, People’s Republic of China — Luckin Coffee Inc. (“Luckin Coffee” or the “Company”), a pioneer of a technology-driven new retail model to provide coffee and other products of high quality, high affordability, and high convenience to customers, has announced its unaudited financial results for the second quarter ended June 30, 2019.
Second Quarter 2019 Highlights
- Total net revenues from products in the quarter were RMB870.0 million (US$126.7 million), representing an increase of 698.4% from RMB109.0 million in the same quarter of 2018.
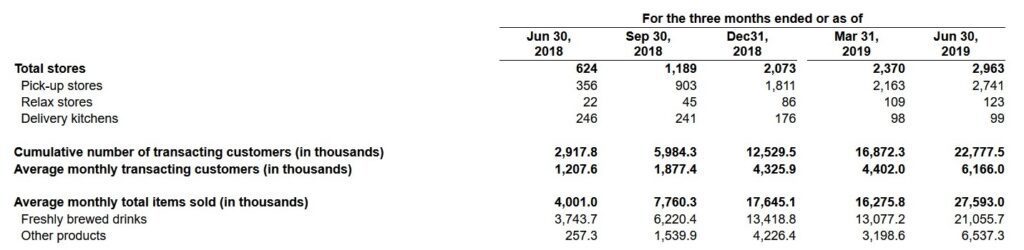
- Cumulative number of transacting customers increased to 22.8 million from 2.9 million as of the end of the second quarter of 2018. During the second quarter of 2019, the Company acquired 5.9 million new transacting customers.
- Average monthly transacting customers in the quarter were 6.2 million, representing an increase of 410.6% from 1.2 million in the second quarter of 2018.
- Average monthly total items sold in the quarter were 27.6 million, representing an increase of 589.7% from 4.0 million in the second quarter of 2018.
- Total number of stores at the end of the quarter were 2,963 stores, representing an increase of 374.8% from 624 stores at the end of the second quarter of 2018.
- Store level operating loss in the quarter was RMB55.8 million (US$8.1 million), decreasing from a loss of RMB81.7 million in the second quarter of 2018.
“We are pleased with the performance of our business as we continue to execute against our long-term growth plan,” said Ms. Jenny Zhiya Qian, Chief Executive Officer of Luckin Coffee. “Total net revenues from products sold increased 698.4% year-over-year, driven by a significant increase in transacting customers, an increase in the average number of items purchased by our transacting customers and higher effective selling prices. We believe this is the result of our distinguished value proposition of delivering our customers high quality, high convenience and high affordability.”

Ms. Qian continued, “At the same time we have substantially reduced our store operating loss as a percentage of net revenues as a result of benefits of scale and increased bargaining power, operating efficiency from technology, and higher store throughput, and we are on track to reach our store level break-even point during the third quarter of 2019.”
“Furthermore, we opened 593 net new Luckin stores during the quarter, providing enhanced convenience to our customers, and strategically launched our new freshly-brewed tea drinks ‘Luckin Tea’ to capture different consumption moments and benefit from strong demand for freshly-brewed tea drinks in China. We also strengthened our supply chain and continued to invest in our brand and our technology. Finally, we remain on track to become the largest coffee network in China in terms of number of stores by the end of 2019,” concluded Ms. Qian.

Second Quarter 2019 Unaudited Financial Results
Total net revenues were RMB909.1 million (US$132.4 million) in the second quarter, representing an increase of 648.2% from RMB121.5 million in the second quarter of 2018. Net revenues growth was primarily driven by a significant increase in the number of transacting customers, an increase in effective selling prices, and the number of products sold.
- Net revenues from freshly brewed drinks were RMB659.2 million (US$96.0 million), representing 72.5% of total net revenues in the second quarter of 2019, compared to RMB100.5 million, or 82.7% of total net revenues, in the second quarter of 2018.
- Net revenues from other products were RMB210.8 million (US$30.7 million), representing 23.2% of total net revenues in the second quarter of 2019, compared to RMB8.4 million, or 7.0% of total net revenues, in the second quarter of 2018.
- Other revenues, which mainly include delivery fees, were RMB39.1 million (US$5.7 million), representing 4.3% of total net revenues in the second quarter of 2019, compared to RMB12.5 million, or 10.3% of total net revenues, in the second quarter of 2018.
Total operating expenses were RMB1,598.8 million (US$232.9 million), representing an increase of 243.9% from RMB465.0 million in the second quarter of 2018. The increase in operating expenses was in line with business expansion. Meanwhile, operating expenses of Luckin Coffee as a percentage of net revenues decreased to 175.9% in the second quarter of 2019 from 382.7% in the second quarter of 2018, mainly driven by increased economies of scale and the Company’s technology-driven operations.

- Cost of materials were RMB465.8 million (US$67.9 million), representing an increase of 514.8% from RMB75.8 million in the second quarter of 2018, in line with the increase in sales of products.
- Store rental and other operating costs were RMB371.5 million (US$54.1 million), representing an increase of 271.7% from RMB99.9 million in the second quarter of 2018, mainly due to increases in the number of stores and headcount.
- Depreciation expenses were RMB88.5 million (US$12.9 million), representing an increase of 491.0% from RMB15.0 million in the second quarter of 2018, mainly due to increases in depreciation of leasehold improvements and purchases of operating equipment.
- Sales and marketing expenses were RMB390.1 million (US$56.8 million), representing an increase of 119.1% from RMB178.1 million in the second quarter of 2018, mainly due to increases in advertising expenses and delivery expenses as the Company launched new marketing initiatives and entered into new cities. Furthermore, free product promotion expenses increased in line with the growth of new transacting customers.
- General and administrative expenses were RMB265.8 million (US$38.7 million), representing an increase of 254.8% from RMB74.9 million in the second quarter of 2018. The increase in general and administrative expenses was mainly driven by business expansion, costs related to the Company’s Initial Public Offering (“IPO”), and share-based compensation to senior management.
- Store preopening and other expenses were RMB17.2 million (US$2.5 million), representing a decrease of 19.4% from RMB21.3 million in the second quarter of 2018, mainly due to decreased rental costs before opening as a result of improved efficiency for new store openings.
Operating loss was RMB689.7 million (US$100.5 million) compared to RMB343.4 million in the second quarter of 2018. Non-GAAP operating loss was RMB619.3 million (US$90.2 million) compared to RMB343.4 million in the second quarter of 2018. For more information on non-GAAP financial measures, please see the section of “Use of Non-GAAP Financial Measures” and the table captioned “Reconciliation of Non-GAAP Measures to the Most Directly Comparable GAAP Measures” set forth at the end of this press release.
Net loss was RMB681.3 million (US$99.2 million) compared to RMB333.0 million in the second quarter of 2018. Non-GAAP net loss was RMB610.8 million (US$89.0 million) compared to RMB333.0 million in the second quarter of 2018.
Basic and diluted net loss per ADS was RMB6.56 (US$0.96) compared to a loss of RMB23.04 in the second quarter of 2018. Non-GAAP basic and diluted net loss per ADS was RMB3.28 (US$0.48) compared to a loss of RMB6.80 in the second quarter of 2018.
Net cash used in operating activities was RMB375.2 million (US$54.7 million) compared to RMB196.0 million in the second quarter of 2018. The increase was primarily driven by an increase in operating expenses as a result of expansion of the Company’s business operations.
Cash and cash equivalents and short-term investments were RMB6,051.2 million (US$881.5 million) as of June 30, 2019, compared to RMB1,761.0 million as of December 31, 2018. The increase was primarily driven by the net proceeds of US$158.8 million from the issuance of Series B-1 convertible redeemable preferred shares in April 2019 to certain investors and the net proceeds of US$657.2 million from the IPO and the concurrent private placement.
Key Operating Data of Luckin Coffee
Guidance
For the third quarter ending 30 September 2019, Luckin Coffee expects net revenues from products to be between RMB1.35 billion and RMB1.45 billion. This forecast reflects the Company’s current and preliminary views, which are subject to change.
Subsequent Events
On July 22, 2019 the Company signed a Memorandum of Understanding with Kuwait Food Company Americana K.S.C.C (“Americana Group”), the largest integrated food product company in the Middle East, to establish a joint venture to launch a new retail coffee business in the Greater Middle East and India.
Key Definitions
- Net revenues from products. Calculated as the sum of net revenues from freshly brewed drinks and net revenues from other products.
- Transacting customers for the period. Refers to a customer who bought at least one item we offer on our mobile apps or through third-party platforms in a given period, regardless of whether the customer paid for the item or merely ordered through our free product marketing initiative. Each unique mobile account is treated as a separate customer for purposes of calculating transacting customer.
- Cumulative number of transacting customers. The total number of transacting customers since our inception.
- Average monthly transacting customers. The number of average monthly transacting customers in the three months during the quarter.
- Average monthly total items sold. Calculated by dividing the total number of items sold during the quarter by three.
- Store level operating profit (loss). Calculated by deducting the cost of materials, store rental and other operating costs, and depreciation expenses from net revenues from products.
- Non-GAAP operating loss. Calculated by adjusting operating loss for non-cash share-based compensation expenses.
- Non-GAAP net loss. Calculated by adjusting net loss for non-cash share-based compensation expenses and change in the fair value of warrant liability.
- Non-GAAP basic and diluted net loss per share. Calculated as non-GAAP net loss divided by weighted average number of basic and diluted share.
- Non-GAAP basic and diluted net loss per ADS. Calculated as non-GAAP net loss divided by weighted average number of basic and diluted ADS.