


By Emma Sage, SCAA Coffee Science Manager
Now that we have released the new SCAA Coffee Taster’s Flavor Wheel, I want to tell you more of the story as to how we got there. Specifically, about the quantity and quality of scientific research that went into this project, which was a massive collaborative effort worth fully explaining. After understanding the power and potential for the World Coffee Research (WCR) Sensory Lexicon, we knew we wanted to adopt and promote it as an association. Aspects of the lexicon can and should be immediately embraced by industry, and therefore SCAA saw a great opportunity to revise the Coffee Taster’s Flavor Wheel.
To create a flavor wheel, you need words and you need to arrange them in a circular fashion, usually with rings or tiers that indicate some relationship, from broad to narrowing specificity. For the words, turned to the WCR Sensory Lexicon, the largest collaborative research project yet in coffee flavor. The Sensory Lexicon is an ideal list of flavor attributes, but does not determine relationships between the attributes. Therefore, SCAA understood an additional scientific study would be necessary. We needed a research partner who was willing to think creatively and do solid research to help us understand how the lexicon should be arranged in terms of tiers/rings as well as placement around a wheel. Given the world-renowned reputation of the sensory science research conducted at UC Davis, we reached out to the food science and technology department to see if any sensory science laboratories could work on this project. Dr. Jean-Xavier Guinard and his PhD candidate, Molly Spencer, were enthusiastic to help.
The UC Davis researchers determined that a modified free multiple sorting method could be used to understand the relationships between the lexicon flavor attributes. In this way, we could understand linkages between and among the main flavor categories as well as relationships amongst the individual attributes, down to the order and placement of the last ring on a new wheel.

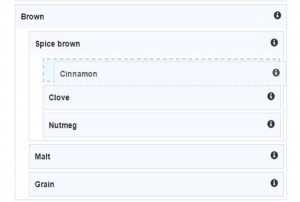
The research included professional coffee tasters invited by SCAA as well as sensory panelists from UC Davis, for a total of 72 individuals. For the modified free multiple sorting method, a web interface (see below example) was created to allow for simple, efficient sorting of the 99 flavor attributes. The user would see instructions and the entire list of attributes, including the definition/description of that attribute as defined by the WCR work. The participant was able to drag and drop the attributes into categories and sub categories, for as many hierarchical levels as they deemed necessary. This data was compiled into a large “similarity matrix” quantifying the number of times flavor attributes were grouped as related, which was then used to complete all further statistical analyses.
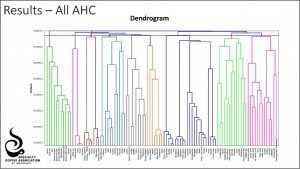
An Agglomerative Hierarchical Cluster (AHC) analysis was performed on the results from the sorting exercise to group the flavor attributes into different categories (or clusters) represented visually by a dendrogram (see the dendrogram results below). The dendrogram allowed us to easily identify 9 main clusters, or flavor categories, that are represented by different colors in the dendrogram. A Multidimensional Scaling (5D-MDS) analysis was also performed to represent the data in a 2-dimensional scatterplot, which helped us visualize where the flavor attributes fell in proximity to one another.
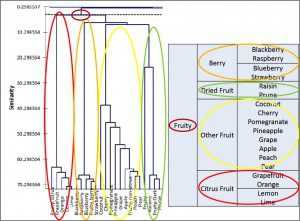
From the results of these two analyses, we were able to begin to piece together what a wheel should look like. To create a wheel from these results necessitated interpreting the statistics. To do this, we created a template that would fit around the wheel by using the dendrogram to create a chart for the main flavor categories (see example with Fruity below). We did this for each main flavor category, while at the same time informing the order and relative placement of second and third tier/ring attributes with the information provided to us by the MDS scatterplot.
In the end, we were able to create a wheel where the main flavor categories, ring levels, and order and placement of the attributes around the rings on the wheel were intentional and research-based, a first in flavor wheel development. In the end, it represents a remarkable collaboration between descriptive panelists, sensory scientists, industry, WCR, SCAA, and UC Davis. It is the product of creative and cutting-edge approach to problem solving on the frontiers of sensory science methods and analyses. It is a tool we can all use and be proud of.
If this is not enough for you – If you are a scientist, science-aficionado or otherwise science-lover, wow, have I got more for you! Not to worry, lover of details and statistics! There is a place for you—inside my heart—and also on a nearby page of the SCAA Digital Chronicle. If you read the whole thing, find me at Expo in April and confess, because I will literally be handing out gold stars!